Step 1: Go to How we’re going
On Home, tapclick See how the week went on the week’s card, or scroll down to How we’re going.
Look forthe See how the week went button
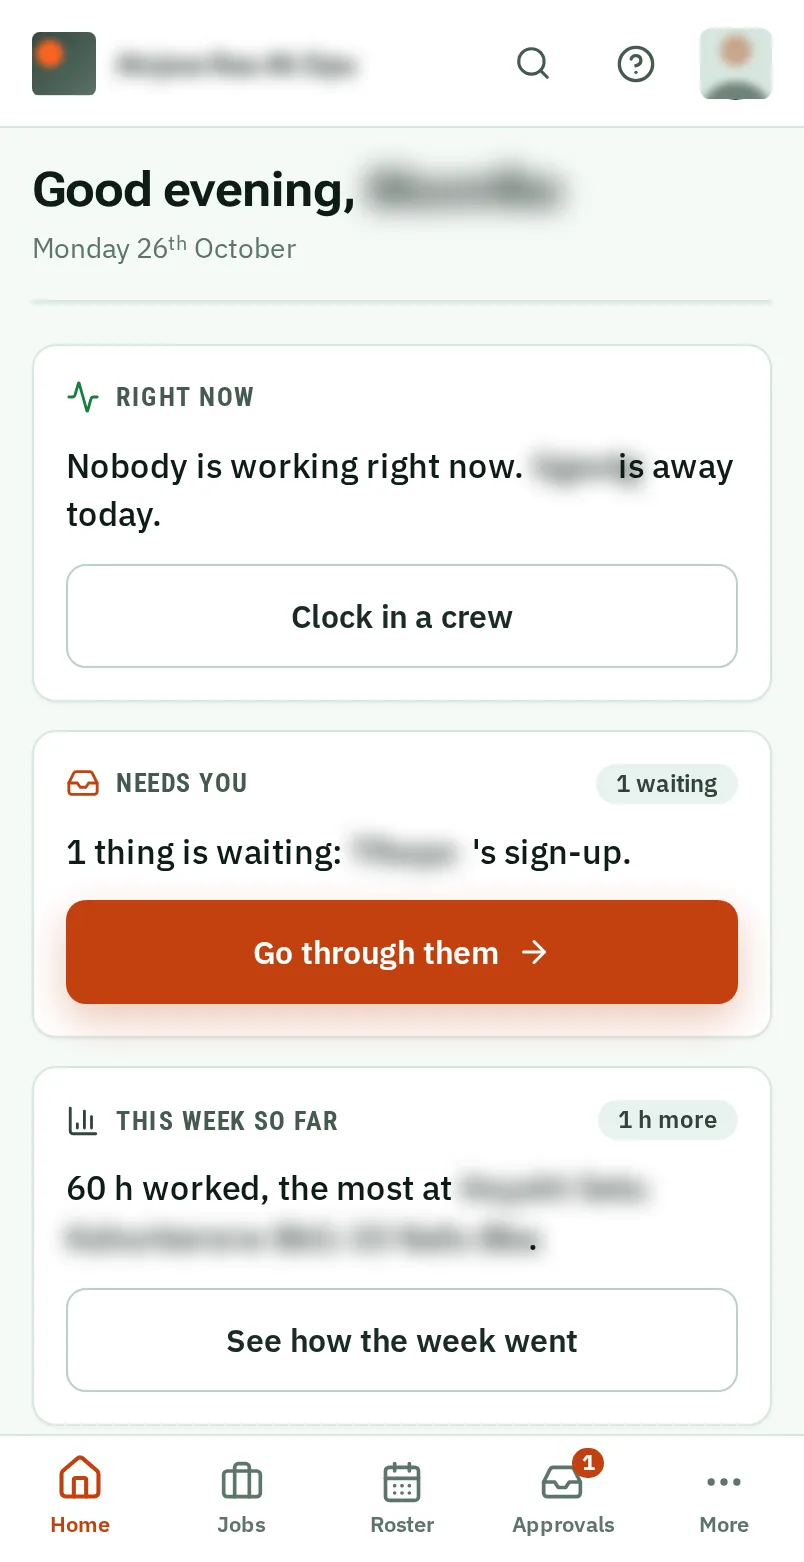
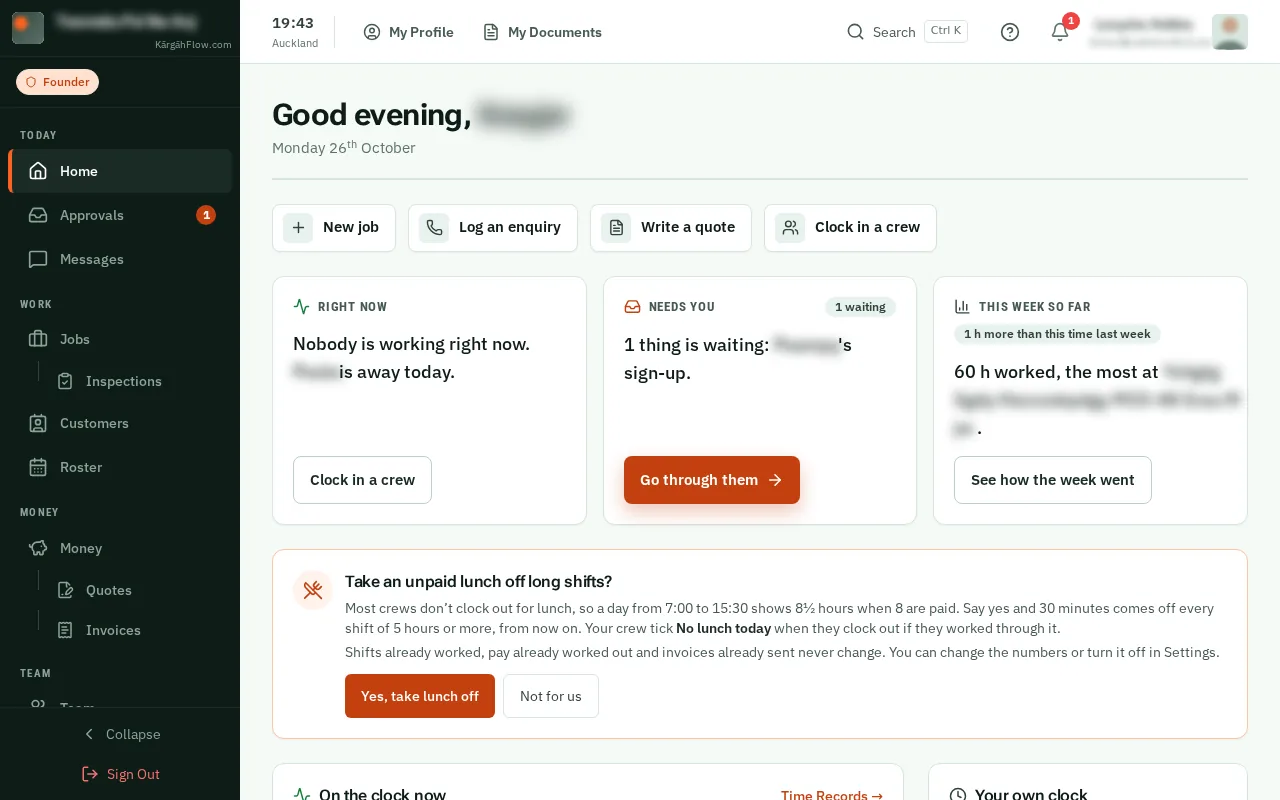
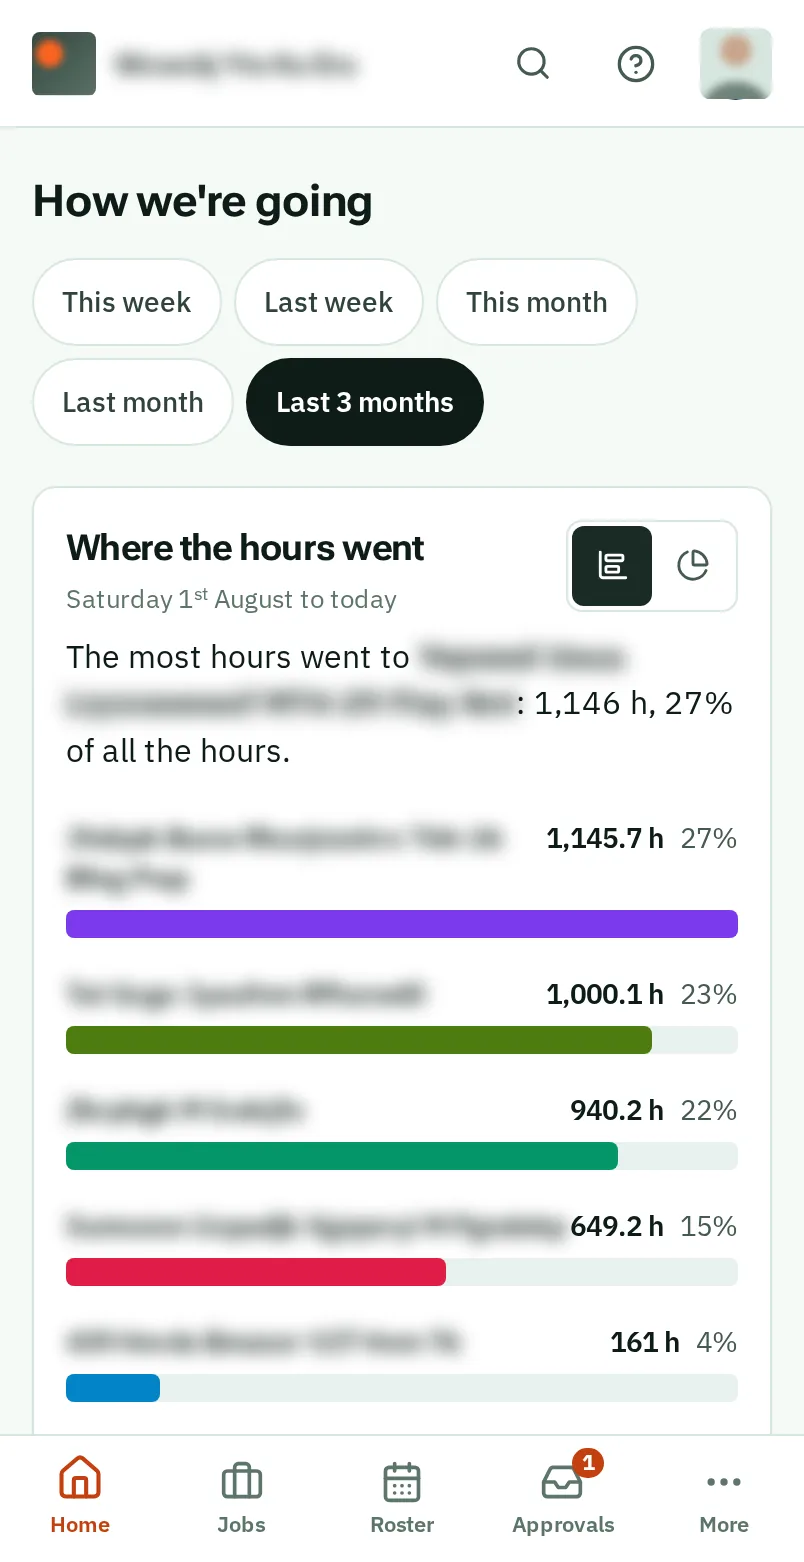
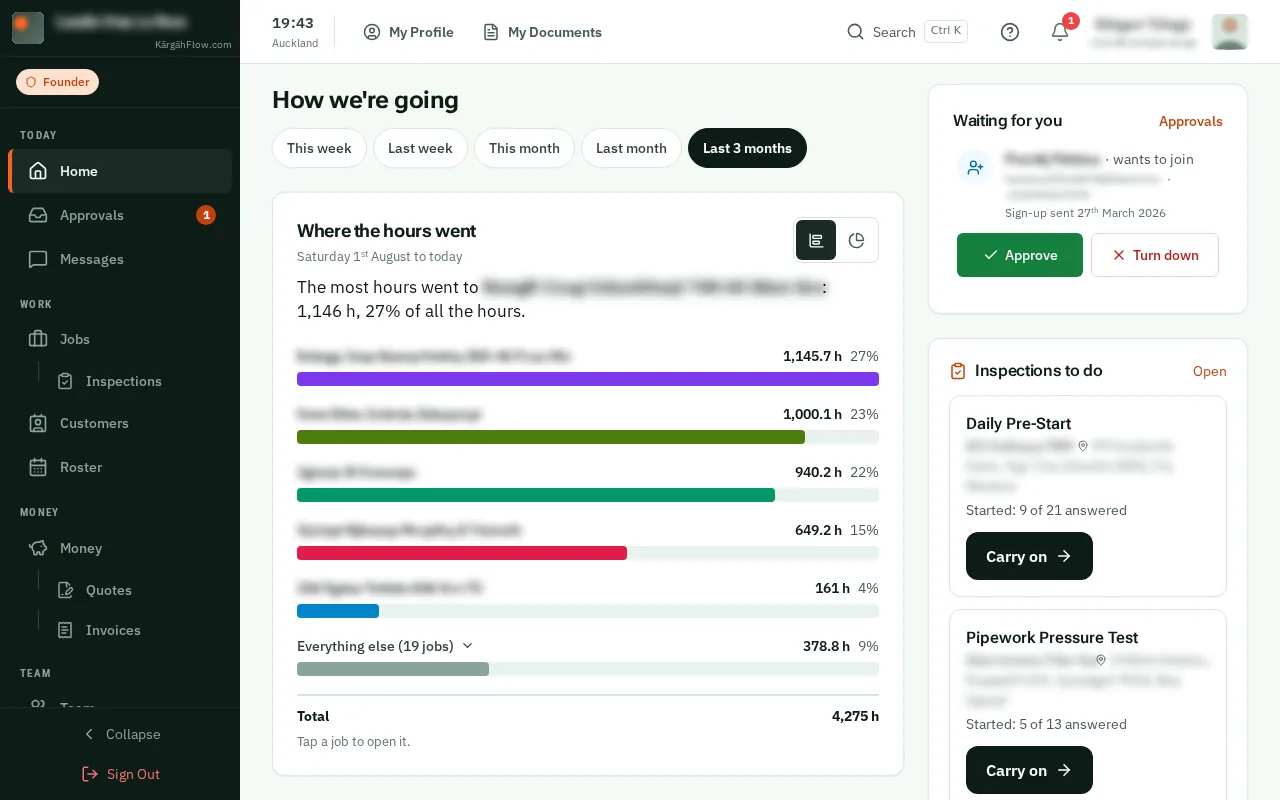
Under How we’re going on Home, the charts show the hours, the spending and the days away for the period you choose.
Each chart opens with a sentence that says what it shows, and every figure is written beside its picture.
On Home, tapclick See how the week went on the week’s card, or scroll down to How we’re going.
TapClick This week, Last week, This month, Last month or Last 3 months. Every chart changes with it.
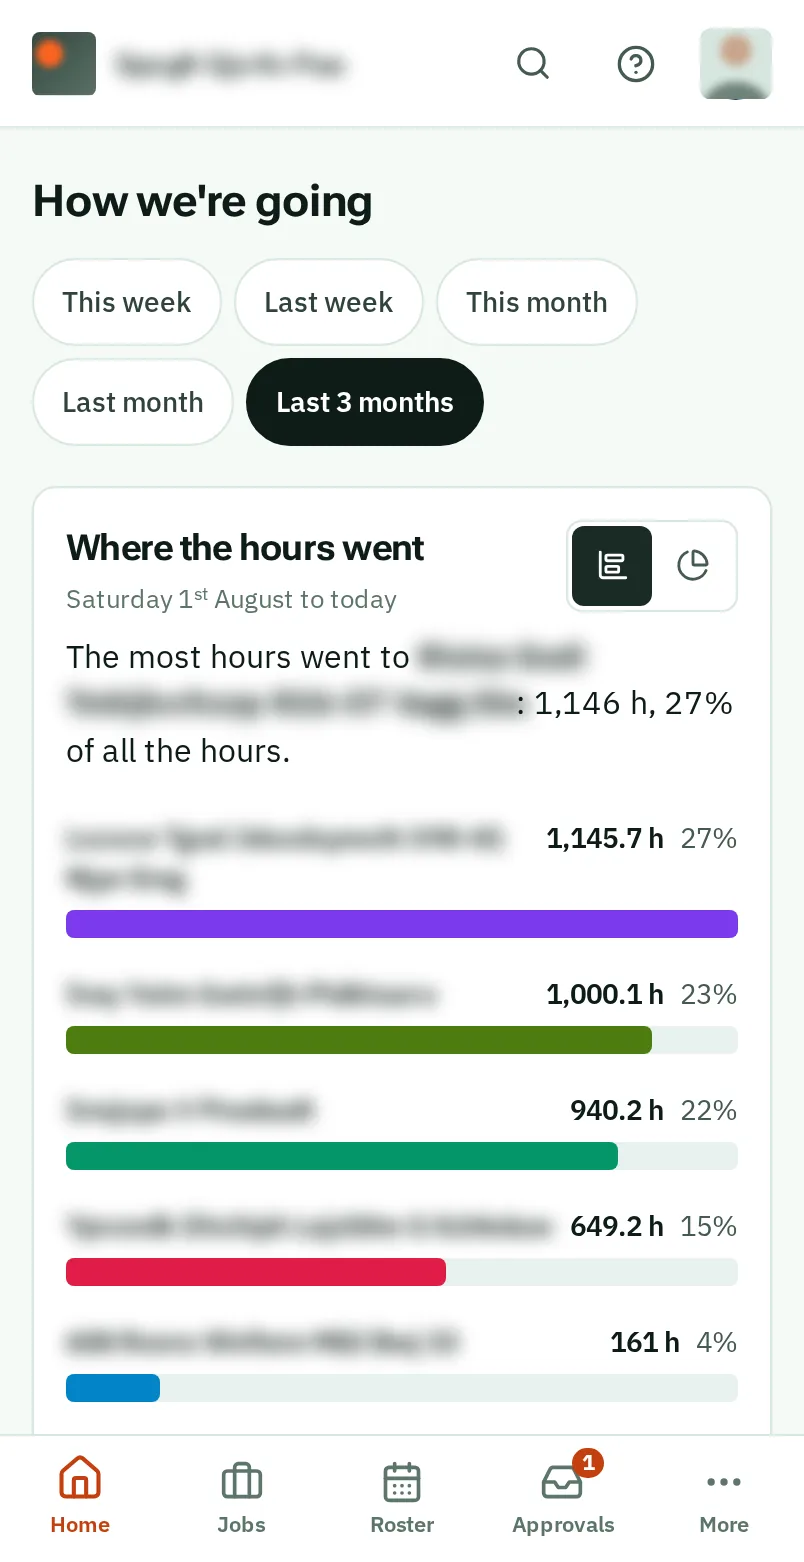
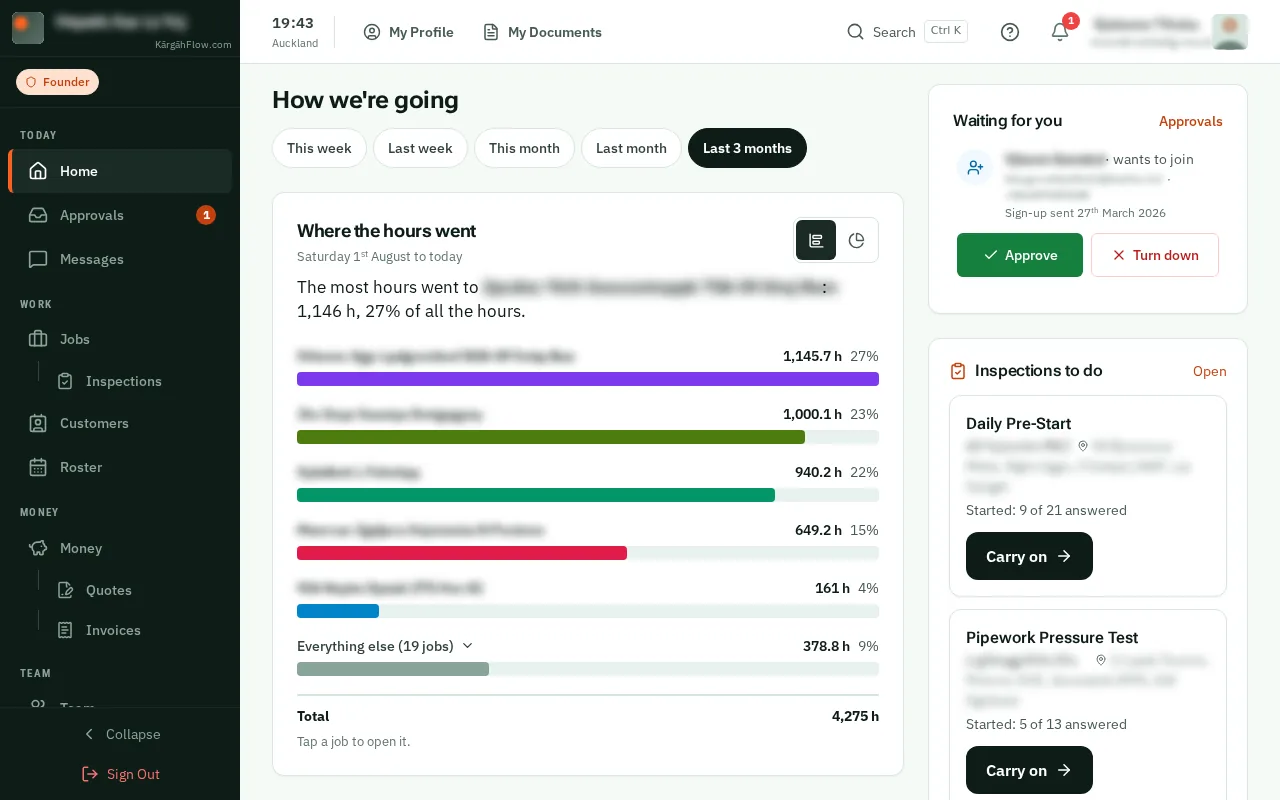
Each job has a bar, the longest first, with its hours and its share of them all. Everything else gathers the smaller jobs: tapclick it to see them. TapClick a job to open it.
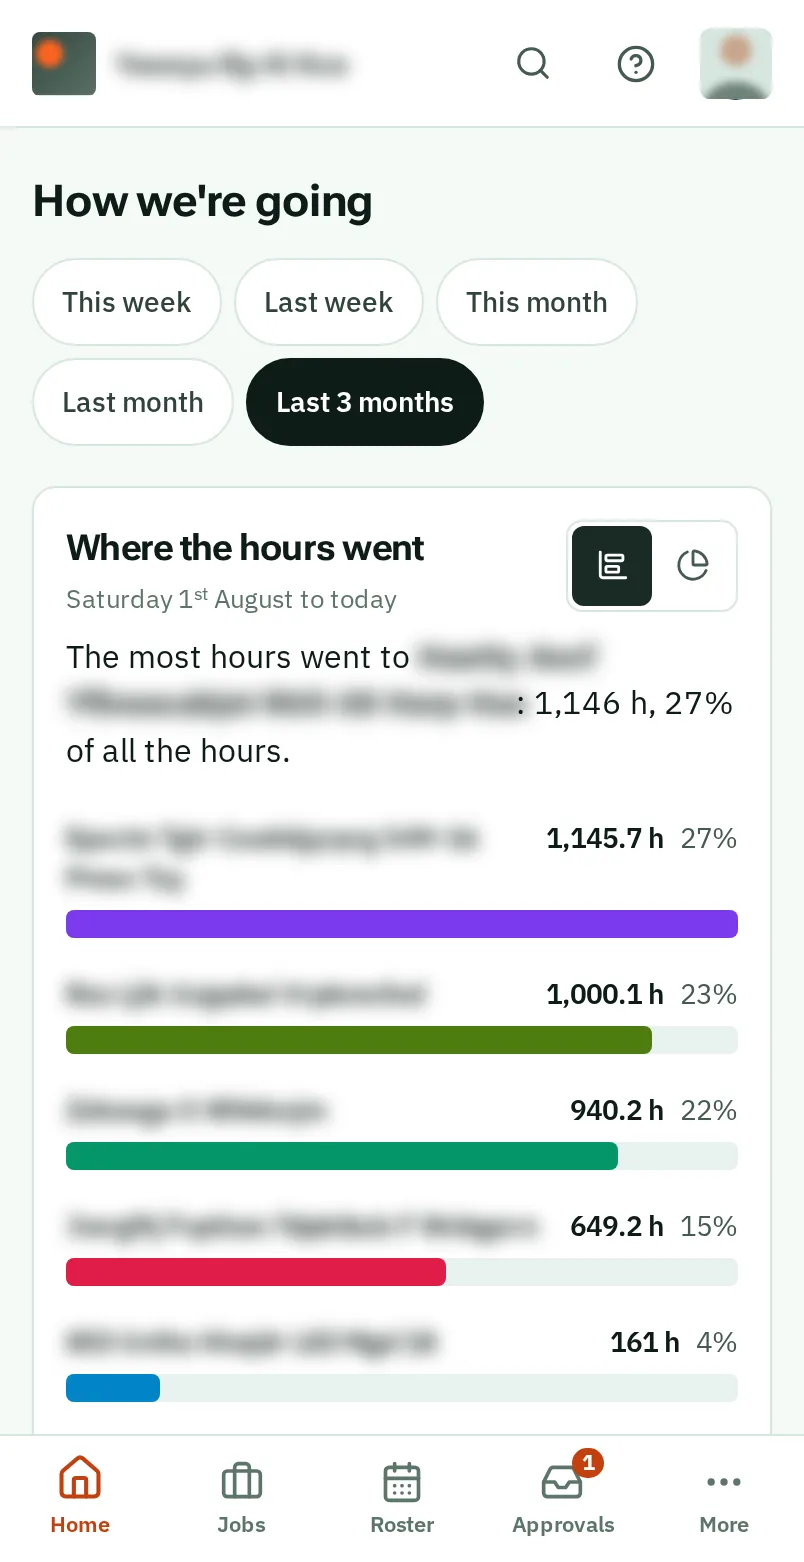
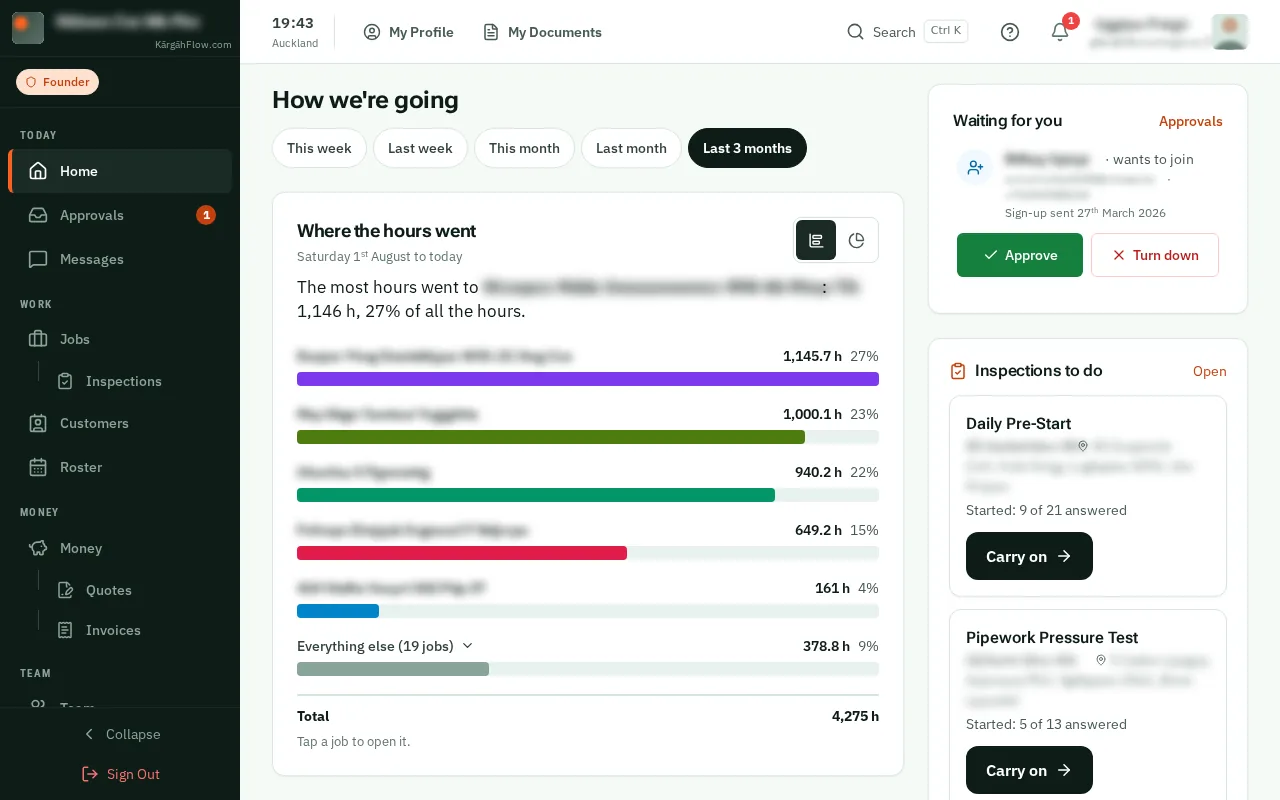
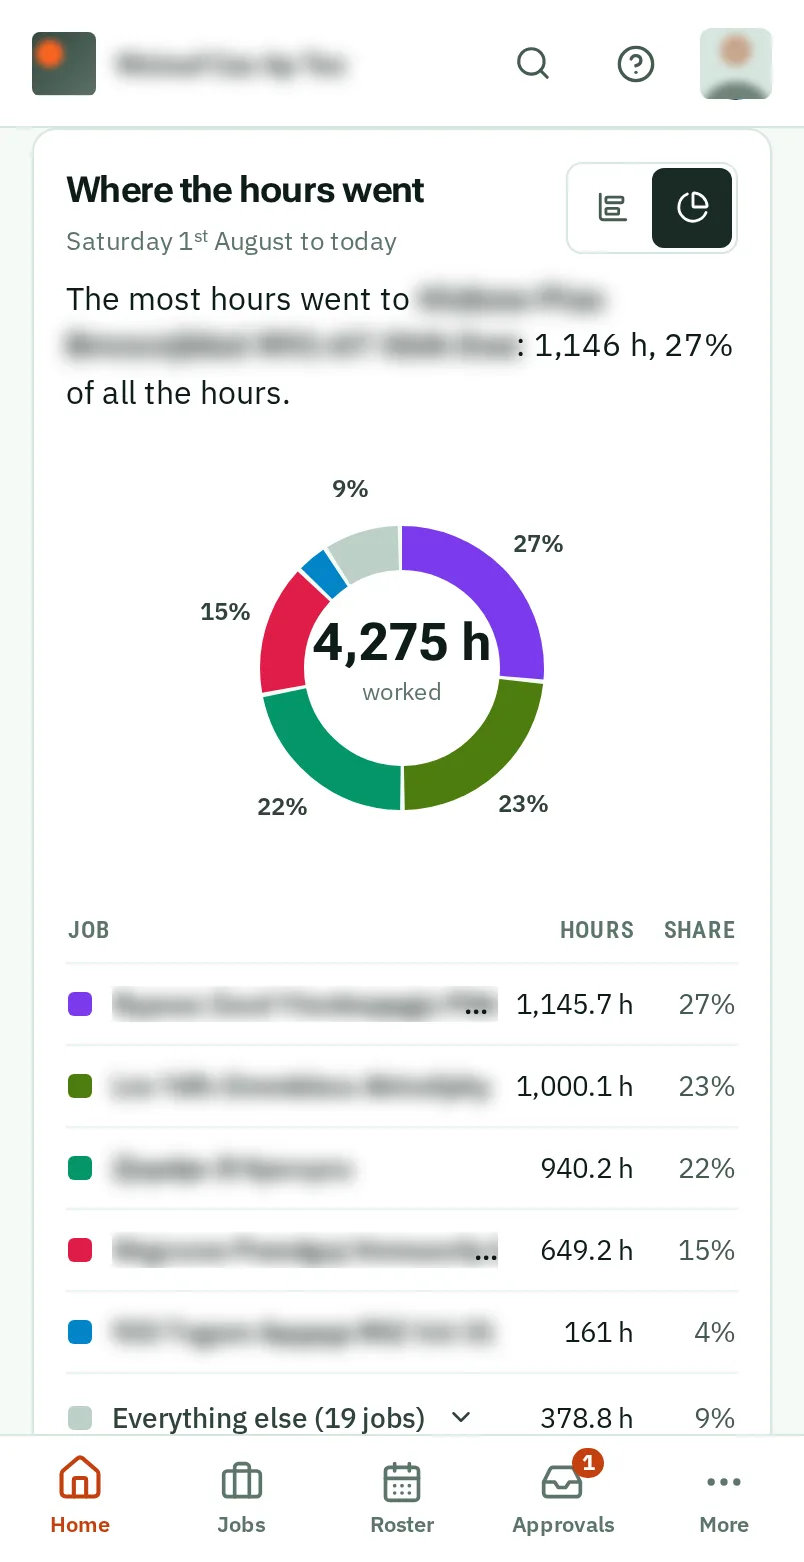
TapClick the ring at the top right of a chart to see it as a ring, with the total in the middle and the same list beside it. TapClick the icon next to it to go back.
Good to know: Each chart keeps the look you choose, on this phone or computer.
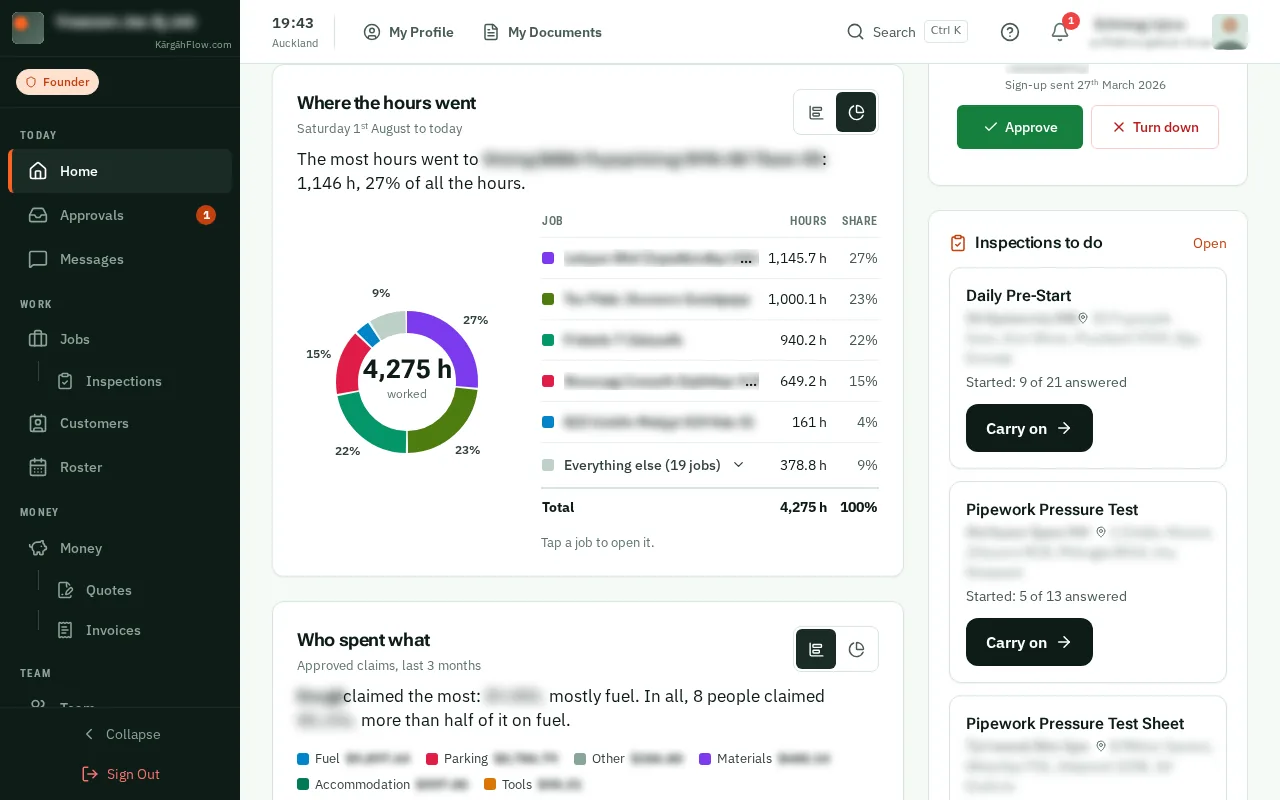
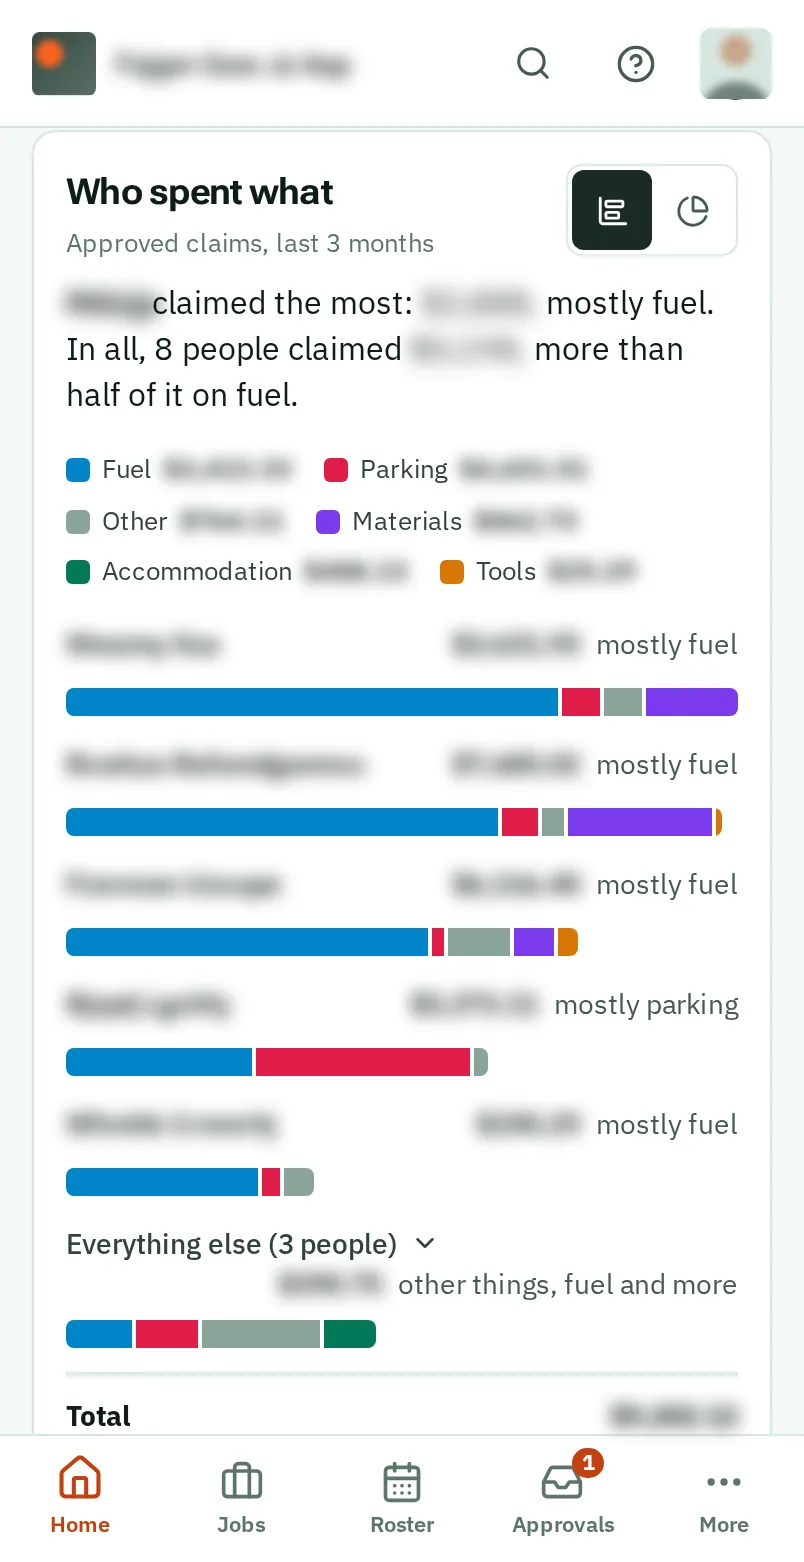
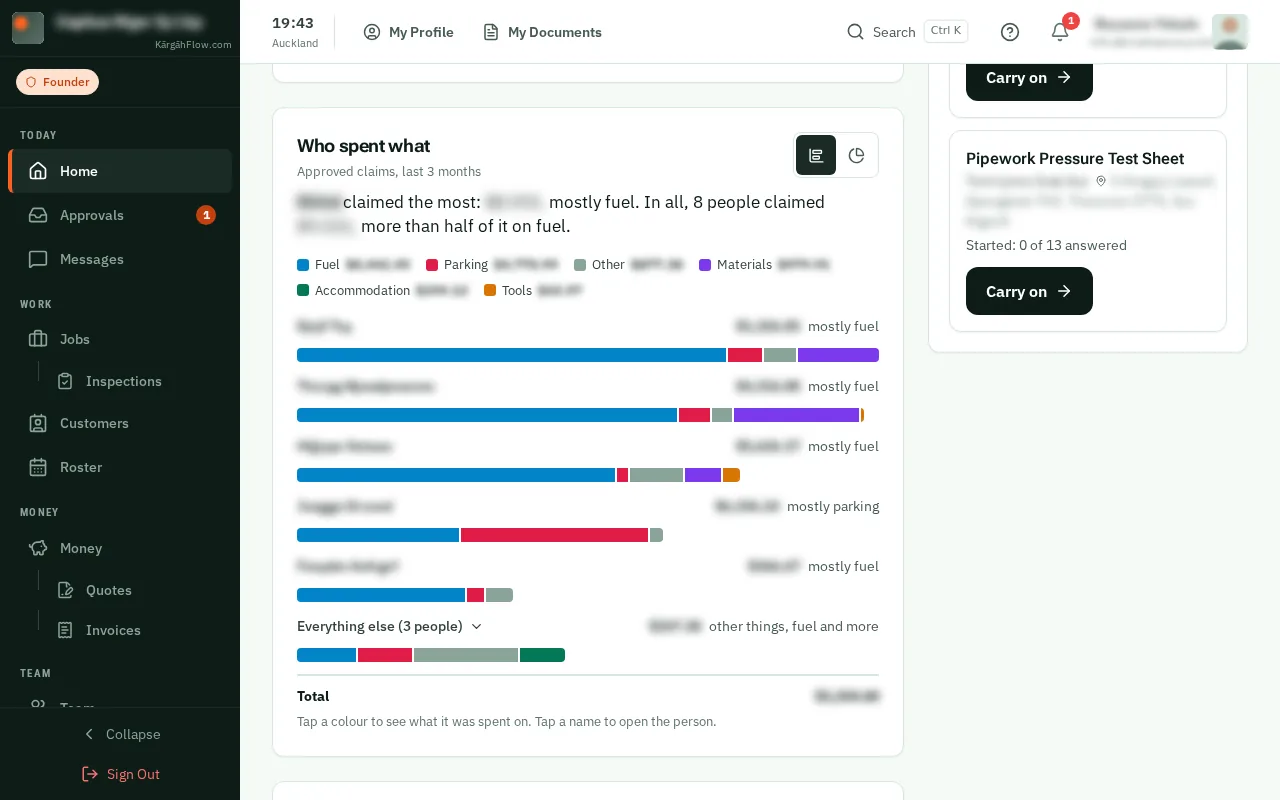
Each person’s approved claims make one bar, split by what they were for, such as fuel, materials and tools, in the colours the key names. TapClick a colour to see what it was.
Good to know: It shows while expense claims are switched on in Settings.
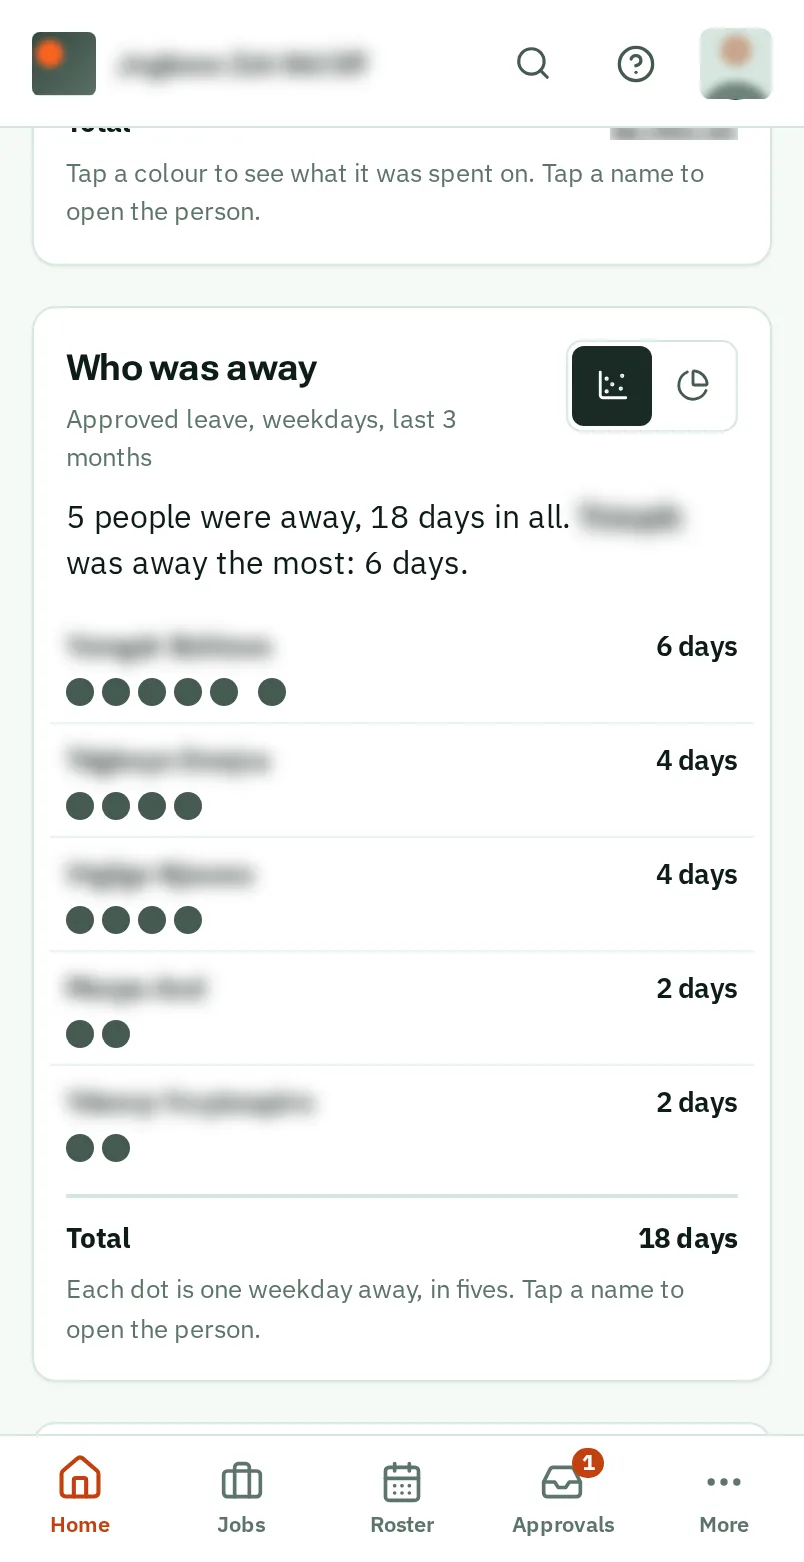
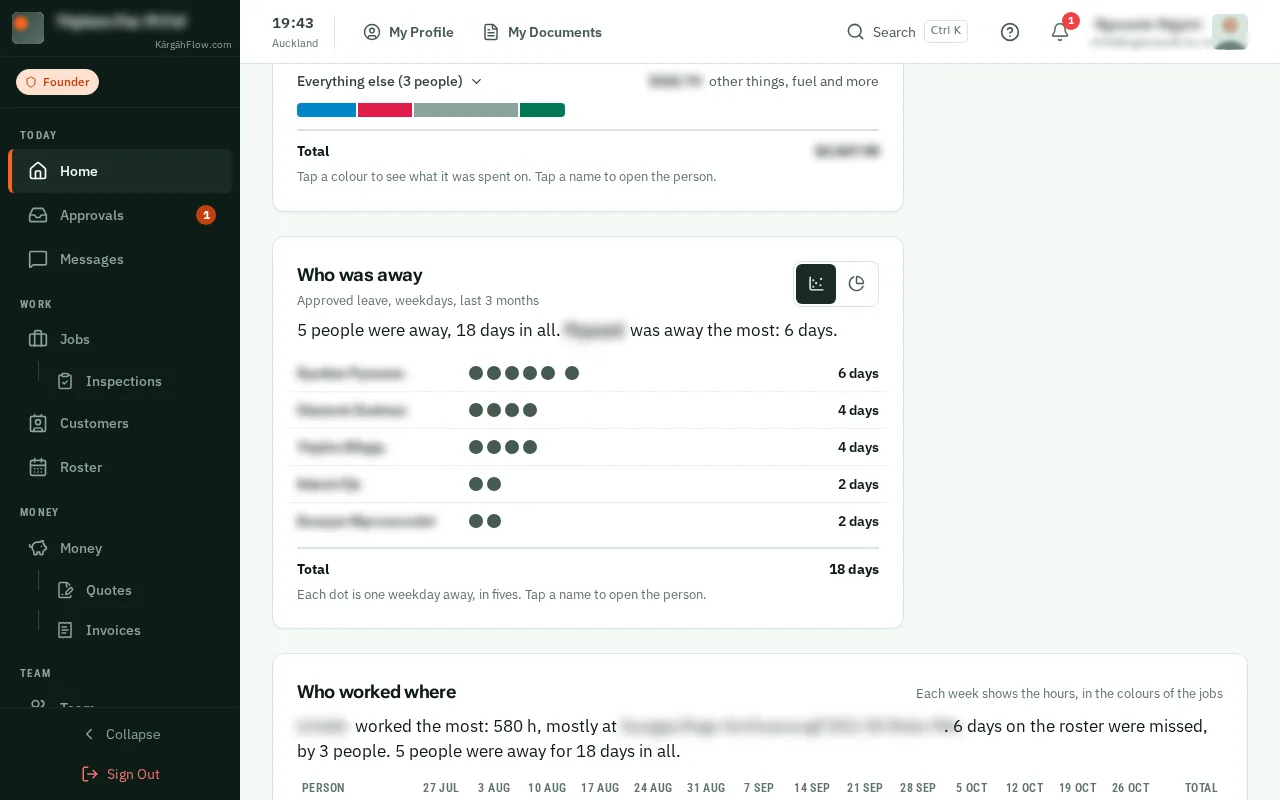
Each person’s approved leave is a row of dots, one for each weekday away, in fives, with the number of days beside them.
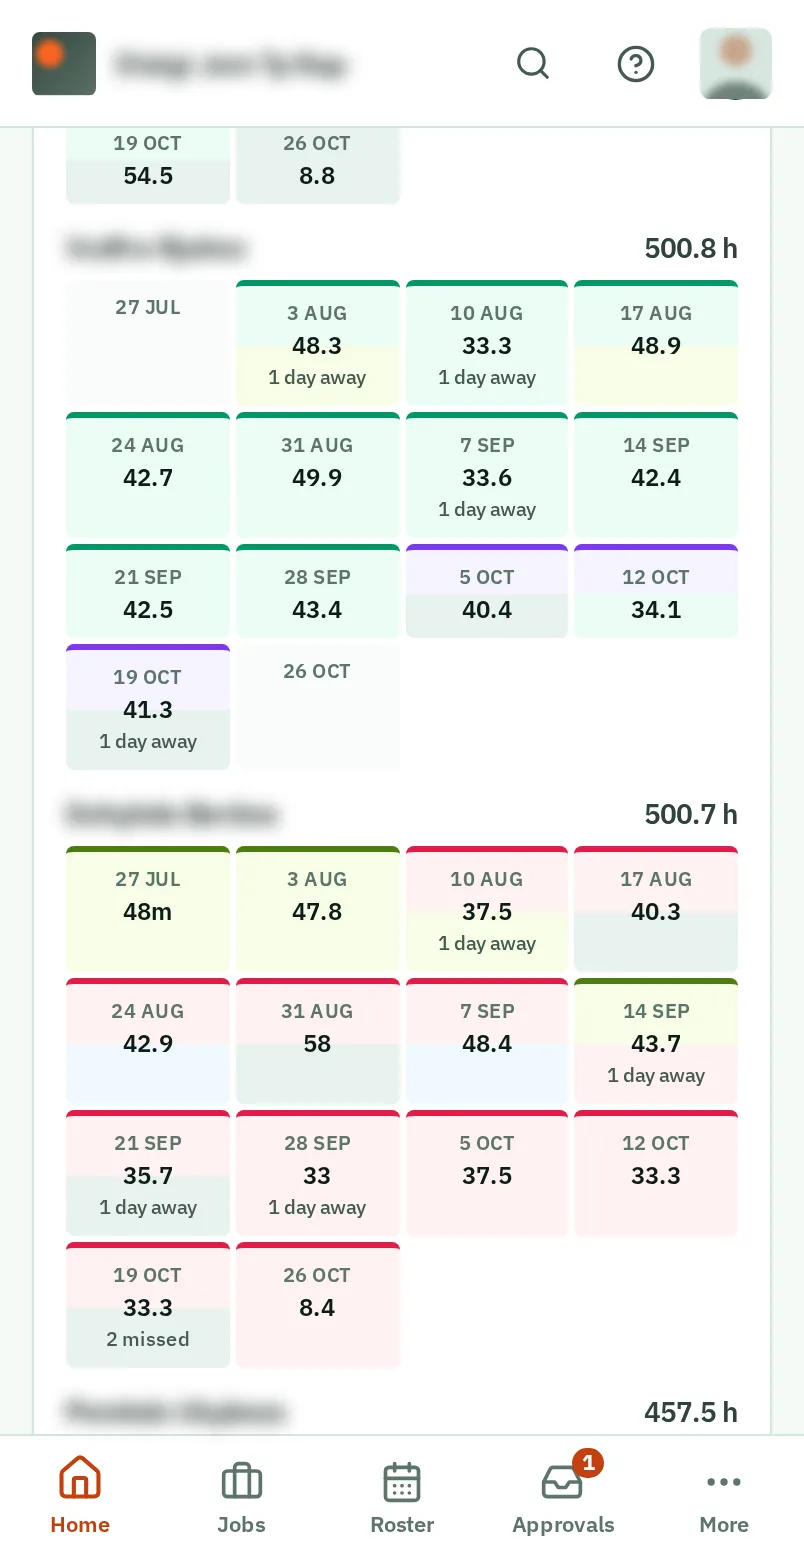
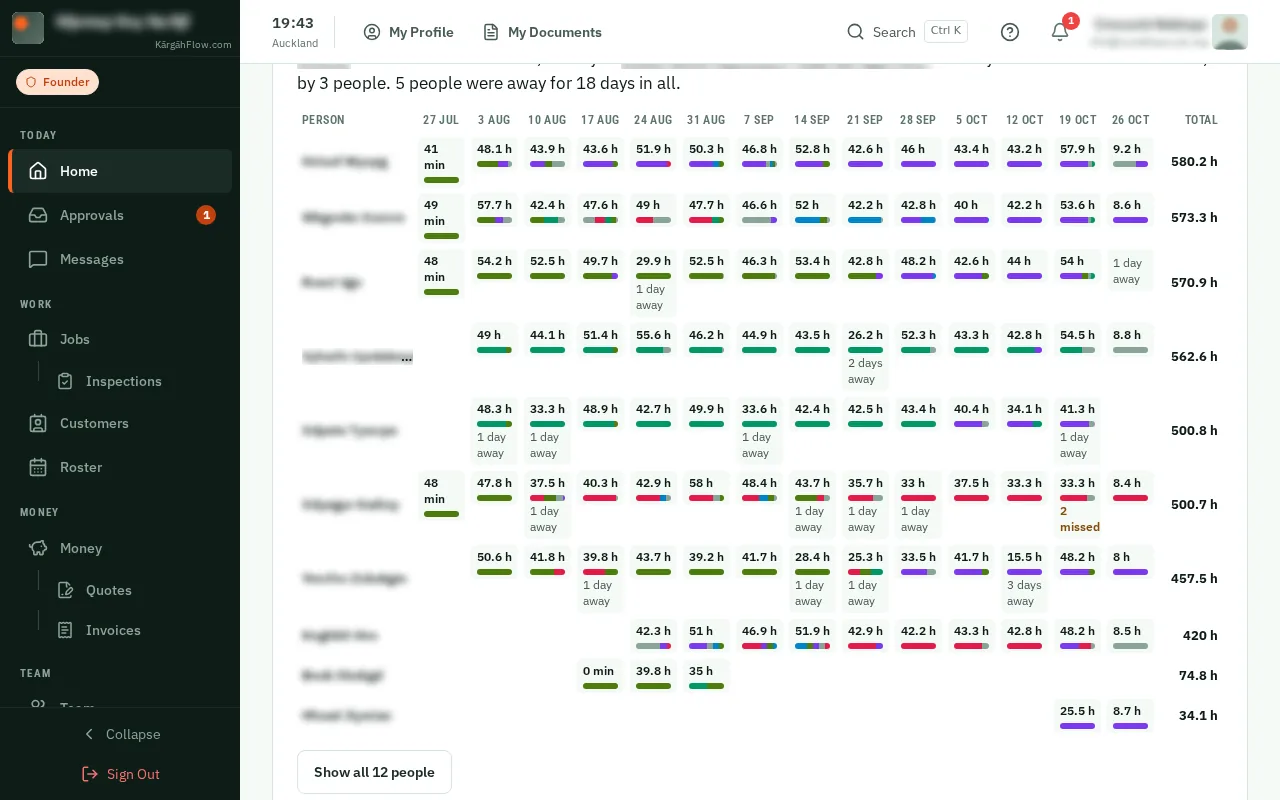
Each person’s days, in the colour of the job they were on, with the hours. A dashed box is a day on the roster with no clock-in, and stripes are a day away. For a month or longer, each column is a week.